The hundreds chart explained for parents (Australia)
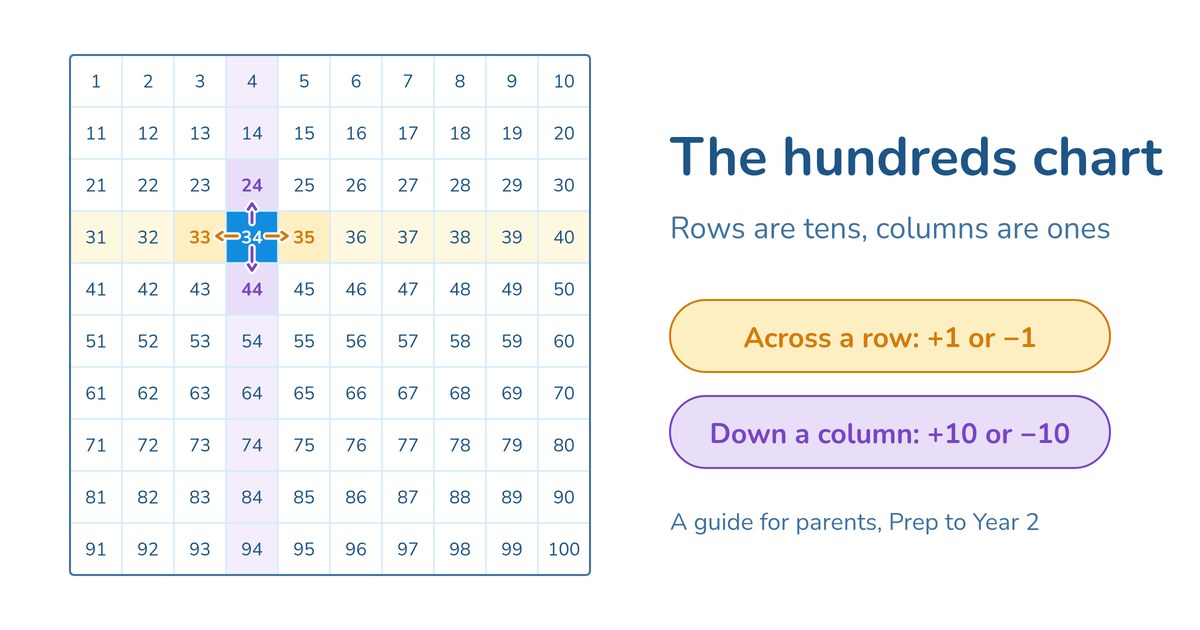
There's a laminated grid of numbers stuck to the wall of almost every junior classroom in Australia. Ten squares across, ten rows down, 1 in the top corner and 100 at the bottom. Your Year 1 child might bring home a worksheet with half the squares blank, or a homework card asking them to "use the hundreds chart" to find 37 + 20.
To an adult it can look like a plain list of numbers in a box. Teachers love it because the arrangement quietly shows how our counting system works. Every row is a group of ten. Every column shares the same ones digit. Moving down one square always adds exactly ten. Once a child sees those patterns, two-digit numbers stop being a long string to count through and start to make sense as tens and ones.
Here you'll find how the chart is laid out, the difference between the two common versions, the moves and patterns children learn, how it helps with adding and subtracting, the curriculum link, the mistakes kids tend to make, and simple ways to use one at your kitchen table.
What a hundreds chart is
A hundreds chart (also called a hundred chart, 100 chart or hundred square) is a 10 × 10 grid holding the numbers from 1 to 100, or from 0 to 99. The numbers run left to right along each row, just like reading a book, and each new row starts where the last one finished.
It looks like a simple counting aid, but it's really a map of place value: where a number sits tells you how many tens and ones it has.
Here are three rows from the middle of a 1 to 100 chart:
| 21 | 22 | 23 | 24 | 25 | 26 | 27 | 28 | 29 | 30 |
| 31 | 32 | 33 | 34 | 35 | 36 | 37 | 38 | 39 | 40 |
| 41 | 42 | 43 | 44 | 45 | 46 | 47 | 48 | 49 | 50 |
The chart starts at 1 in the top-left corner and finishes with 91 to 100 on the tenth row.
1 to 100 or 0 to 99?
Your child's classroom may use either version, and it helps to know which one they're used to.
The 1 to 100 chart is the most familiar. It matches the way young children count (starting at one) and finishes neatly on 100. The catch is that each row ends on a multiple of ten. So 30 sits at the end of the row that starts with 21, even though 30 "belongs" with the thirties.
The 0 to 99 chart starts with 0 in the top-left corner. Every row then holds numbers with the same tens digit: the top row is 0 to 9, the next is 10 to 19, then 20 to 29, and so on. The tens digit tells you the row, the ones digit tells you the column. Many maths educators prefer this layout for place value because the pattern is perfectly clean, and it includes zero.
Neither is wrong. If home and school charts differ, just point it out.
The secret: rows are tens, columns are ones
The single most useful thing a child can notice is this:
- Look across a row, and the ones digit counts up by one each step while the tens digit mostly stays the same.
- Look down a column, and the ones digit never changes while the tens digit goes up by one each step.
Take the column under 7 on a 1 to 100 chart: 7, 17, 27, 37, 47, 57, 67, 77, 87, 97. Ask your child what's the same and what's changing. Most will spot that "they all end in 7" and that "the first number goes up". That's place value in their own words.
If the words "tens" and "ones" still feel fuzzy, the place value guide explains the idea from the beginning, and the guide to bundling tens shows the hands-on groundwork that sits underneath.
Moving around the chart
Teachers often describe the chart in terms of moves. There are four main ones:
- Right one square: add 1 (34 → 35)
- Left one square: take away 1 (34 → 33)
- Down one square: add 10 (34 → 44)
- Up one square: take away 10 (34 → 24)
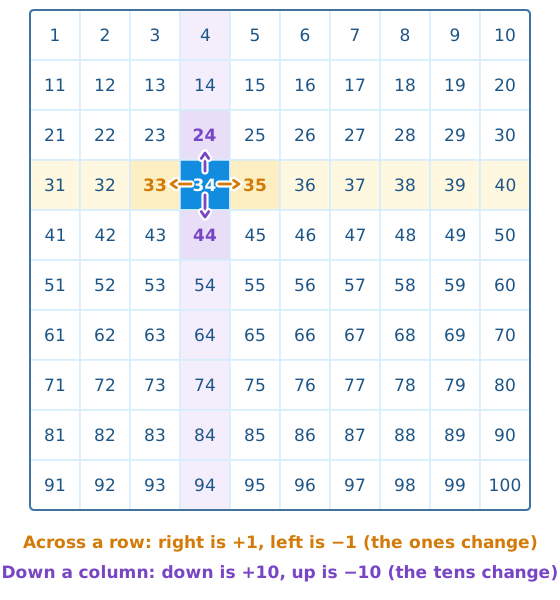
Older children add diagonals: down-right is add 11 (34 → 45), down-left is add 9 (34 → 43).
The vertical moves are the big deal. A child who knows that one step down is ten more no longer needs to count 35, 36, 37 … all the way to 44. That shift from counting by ones to thinking in tens is one of the major milestones of the early years. The ten more, ten less guide goes much deeper on that one skill, including what happens near 100.
Wrapping at the edge
A move that runs off the end of a row carries on at the start of the next one, like a sentence wrapping onto a new line. On a 1 to 100 chart, one more than 40 is 41, at the start of the row below.
Patterns worth spotting together
Colouring patterns is a classic Year 1 and 2 activity. Children usually discover:
- Counting by tens makes a single straight column (10, 20, 30 … 100 on a 1 to 100 chart).
- Counting by fives makes two columns, the 5s and the 10s.
- Counting by twos colours every second column, which are the even numbers. The odd and even guide explains why only the last digit decides.
- Counting by threes makes slanting diagonal lines, which surprises most kids.
- Counting by nines makes a diagonal stepping down to the left: 9, 18, 27, 36, 45, 54, 63, 72, 81. Each step is one row down and one column left, because adding 9 is the same as adding 10 and taking away 1.
- Counting by elevens makes a diagonal stepping down to the right: 11, 22, 33 … 99.
Each pattern links to skip counting and later the times tables; the 9s diagonal shows why that table's tens digit rises as its ones digit falls.
For upper primary children, a hundreds chart is also the classic way to find prime numbers. Cross out 1, then every multiple of 2 except 2 itself, then the other multiples of 3, 5 and 7 (keeping 3, 5 and 7 themselves). The 25 numbers left uncrossed are the primes below 100. This old method is called the Sieve of Eratosthenes, and it's a satisfying rainy-afternoon task. The divisibility rules guide explains some of the column patterns that appear.
The wider idea of spotting and continuing number patterns is covered in the patterns guide.
Adding and subtracting on the chart
By Year 2, many classes use the chart as a thinking tool for two-digit sums. The trick is to break the second number into tens and ones, then move.
34 + 25. Start on 34. Move down two rows for the 20 (44, 54). Move right five for the 5 (55, 56, 57, 58, 59). Answer: 59.
46 + 38. Start on 46. Down three rows for 30 (56, 66, 76). Then right eight, wrapping at the edge (77, 78, 79, 80, 81, 82, 83, 84). Answer: 84.
A child who is ready for a shortcut might instead go down four rows to 86 (adding 40), then step back left two squares to 84. Adding a little too much and taking off the extra is one of the mental maths strategies the chart makes visible.
72 − 38. Start on 72. Up three rows for 30 (62, 52, 42). Then left eight (41, 40, 39, 38, 37, 36, 35, 34). Answer: 34.
Finding the difference. How far is it from 47 to 83? Start on 47 and move down until you're in the right row: 57, 67, 77, which is three rows, or 30. Then count right from 77 to 83, which is 6 more. The difference is 36.
These are the jump-of-ten ideas behind addition and subtraction. Later, schools move children to the empty number line, where they draw the same jumps freehand.
Puzzles that build place value
Small puzzles show whether the layout really makes sense to your child.
Missing squares. Cover a few numbers with sticky notes or coins and ask what's hiding. Can they work out 58 because it's under 48, without counting from 1?
Chart jigsaw pieces. Cut a small shape out of a printed chart, such as a plus sign with 56 in the middle. Leave only the middle square filled in and ask your child to fill the rest. The answers: 46 above, 66 below, 55 to the left, 57 to the right.
Mystery number. Give clues: "I'm ten more than 38, and one less than 49. Who am I?" (48). Then swap roles and let your child make up clues for you.
Battleship. Each of you secretly picks a number. Take turns guessing, and answer only "higher", "lower", "same row" or "same column". It's a sneaky way to practise comparing numbers.
Going past 100
The Australian Curriculum asks Year 1 children to work with numbers to at least 120, and Year 2 to at least 1000. So the grid doesn't stop at 100.
Many classrooms use a 120 chart, which just adds two more rows (101 to 110 and 111 to 120). Others use charts for 101 to 200, or 201 to 300. The patterns stay exactly the same: down one is still ten more, and columns still share their ones digit.
Seeing 95 and 105 one above the other helps children notice that the 5 stays put while the tens tick over into a new hundred, so they don't write 105 as 1005. The guide to zero holding the place covers that tricky moment.
Hundreds chart or number line?
They do different jobs, and children benefit from both.
A number line shows numbers as distances in one long row. It's great for showing that 60 is further along than 16, for rounding, and for working with fractions and decimals later on.
A hundreds chart folds that long line into rows of ten. You lose the sense of distance, but you gain a clear view of the tens structure. It's better for seeing patterns and for jumping by tens.
A child who can say "going down a row is like jumping ten along the line" has connected the two nicely.
Where hundreds charts appear in the curriculum
The Australian Curriculum (version 9) actually names charts. In Year 1, children are expected to recognise, represent and order numbers to at least 120 using materials, numerals, number lines and charts. The suggested activities for teachers even include building a hundreds chart from cards numbered 0 to 99 and colour-coding tens and ones.
By the end of Year 1, children should be able to partition two-digit numbers into tens and ones and skip count by twos, fives and tens. In Year 2 the range stretches to 1000. The chart supports all of these. For the bigger picture, see what Year 1 maths covers and what Year 2 maths covers.
What to expect from Prep to Year 3
Children move at their own pace, but roughly:
- Prep: finding numbers to 20 and beyond; noticing the teen numbers sit together in one row (Prep maths).
- Year 1: ordering numbers to 120, ten more and ten less, colouring skip-counting patterns.
- Year 2: adding and subtracting two-digit numbers with jumps, and bigger charts.
- Year 3 on: hunting patterns for multiplication, primes and factors and multiples.
Slip-ups to watch for
Moving down for one more. Some children step down a square when they mean to add 1, because "down" feels like "next". Saying the move out loud helps: "Sideways is one, down is ten."
Counting the starting square. For 34 + 3, a child puts their finger on 34 and says "one" before they move, landing on 36. This is the same off-by-one slip that happens on number lines. Teach them to say "one" only as they land on 35.
Getting lost at the end of a row. Going right from 40 on a 1 to 100 chart, they look for 41 in the same row. Practise a few "wrap-around" moves until it feels natural.
Mixing up teen and ty numbers. Fourteen and forty sound alike, and children often point to the wrong square. Ask them to say "one ten and four" or "four tens" to check.
Treating the chart as a lookup. Counting square by square for ten more means the chart is a list, not a map. Covering squares nudges them to use the structure.
Making and using a chart at home
You don't need a fancy resource. Draw a 10 × 10 grid on paper or a whiteboard, or print a free one. Some ideas:
- Build it together. Lay numbered cards out in rows. Making the chart teaches more than staring at a finished one.
- Use counters. Drop a coin on a number and ask for ten more, ten less, one more and one less.
- Colour a pattern a week. Twos one week, fives the next, then threes. Talk about the shapes that appear.
Five relaxed minutes after dinner will do more than a long worksheet. If practice tends to end in arguments, homework without tears has gentle ideas.
Signs a child needs more help with numbers to 100
It's normal for a Year 1 child to still count square by square sometimes. It's worth a chat with the teacher if, by around the end of Year 2, your child:
- can't find a two-digit number on the chart without counting from 1
- doesn't notice that numbers in a column end in the same digit, even when it's pointed out
- always counts by ones for ten more, with no sense of moving down a row
- regularly writes numbers like sixty-two as 602 or 26
These can point to gaps in the earlier foundations of counting and place value, which are very fixable when caught. Two guides can help you weigh it up: one on checking if your child has fallen behind, and one on the signs worth worrying about.
FAQ
What is a hundreds chart used for?
Learning the order of numbers to 100, seeing tens and ones, finding ten more or less, spotting skip-counting patterns, and adding or subtracting with jumps of ten.
Should my child use a 0 to 99 chart or a 1 to 100 chart?
Either is fine. The 0 to 99 version shows tens and ones more cleanly because each row shares a tens digit, while the 1 to 100 version matches early counting. Use whichever your child's class uses.
What age is a hundreds chart for?
Mostly Prep to Year 2 (about ages five to eight), though older children use it for multiplication patterns and primes.
A five-minute starter
Put a coin on 23. Ask your child to move it down one square and tell you the new number, then down again, and again. After a few moves, ask: "What keeps happening to the number each time you go down?" Let them put it in their own words before you name it.
If you'd like a clearer view of where your child's number skills are up to, Ziado's free check is a short online activity your child does at home in around ten minutes. The questions adjust to how they're going, so it doesn't feel too hard or too easy. You'll get some early results straight away without making an account or entering card details, and the complete placement arrives after sign-up. It won't score hundreds-chart skills on their own, it isn't NAPLAN practice, and it isn't a diagnosis of any learning difficulty. You can see what regular practice looks like on the Ziado maths page. You can trial either plan, Individual or Family, free for 14 days; pricing shows what's current.
Curious how your child's number skills are tracking?
Ziado's free check is a one-off, roughly 10-minute adaptive diagnostic with partial results only - no account, no card. The full placement unlocks after signup.
Start the free maths check